Red Light Therapy for Fertility - Is It Working?
How Do I Know It’s Working?
You’re scrolling through your favorite fertility Facebook group when you notice a post that stops you mid-scroll:
"I’m 9 weeks pregnant and selling my red light device, guess I don’t need it anymore!"
Within minutes, the questions and congratulation wishes come flooding in: “How did you use it?” “What settings? How often?” Women are eager to know the secret combination of timing, dosage, and consistency that made it “work.” But here’s where the story gets more complex.
What we don’t see in that single post are all the other factors, known in research as confounders - that may have played a role in her result. Maybe she just started CoQ10 and NAC the same week she began red light therapy. Maybe her partner improved his nutrition or started new supplements. Perhaps she’d been traveling across time zones, adjusting her circadian rhythm, or managing thyroid changes.
In science, these are called confounding variables, factors that can influence both the “exposure” (in this case, PBM use) and the “outcome” (a positive pregnancy test). If they aren’t recognized, they can make it look like one thing caused another when, in reality, several variables overlapped to create that outcome.
This is why structured self-charting, biomarker tracking, and consistent context notes are so important. They allow women to distinguish what’s improving because of PBM and what might be shifting because of supplements, travel, hormone changes, or sheer time.
In the sections that follow, the blog explores not just how to see if your PBM is working, but how to understand your results in the real world, where confounding variables are part of every fertility journey. The goal isn’t just to celebrate someone else’s wonderful news, it’s to understand your own response clearly enough that you can replicate progress intentionally in a way that is aligned with the current evidence.
This guide integrates the latest science and practical self-tracking protocols so women can confidently monitor their responses over time. If you’ve been consistently using your device for at least 3 cycles and are not seeing measurable, objective changes all is not lost and I can help.
Tracking changes (or lack of changes) lets you know if you’re getting the most from your red light device.
Seeing and Feeling the Impact of Red Light Therapy
When used regularly, red light therapy often has visible benefits for wound healing (usually within a few days). When I use it with breastfeeding moms with blocked milk ducts - the change is often seen in minutes.
· For skin and wounds: Faster healing, reduced redness, and smoother scars show tissue-level repair and collagen activation.
· For joints and muscles: Improvements in flexibility, recovery speed, and chronic pain signify reduced inflammation and better oxygenation.
· For reproductive health: Renewed ovarian function, more consistent cycles, and better egg quality reflect mitochondrial rejuvenation and circulatory support in the ovaries and uterus.
PBM doesn’t mask symptoms; it restores cellular function. That means changes are often subtle at first, but measurable when tracked consistently. These changes are quite easy to track - the evidence is quite obvious but we need to understand what’s happening at a deeper level when it comes to reproductive health.
What Happens Beneath the Surface
While surface improvements show up in skin or energy, PBM is ultimately working inside your body, the cellular, vascular, and hormonal layers that sustain long-term fertility and health. Studies suggest it can:
· Modulate hormones via effects on the hypothalamic-pituitary-ovarian axis, promoting more regular ovulation and progesterone cycles.
· Revitalize ovarian tissue by reducing oxidative stress, improving angiogenesis, and rejuvenating aging follicles.
· Enhance endocrine balance by supporting thyroid and adrenal activity, which improves sleep, mood, and energy.
Multiwavelength PBM improves unexplained infertility outcomes and live births by modulating oxidative stress and enhancing endometrial receptivity.
Near-infrared PBM reverses ovarian aging through mitochondrial rejuvenation and increased angiogenesis (formation of new blood vessels).

If You’re Living With Endometriosis
Even if TTCing many women with endo use red light therapy for their quality‑of‑life including pain relief, mobility, bowel/bladder comfort, or post‑surgical healing, whether or not pregnancy is not something you’re considering right now. Here’s some ways you can track changes:
Date / cycle day (if applicable)
Red light therapy: body area(s), minutes, settings, and timing vs pain flares (e.g., pre‑period, ovulation, post‑exercise).
Pain scores at three anchor points (waking, midday, evening) and include what you were doing at the time.
Bowel/bladder, sex, and fatigue (use a simple 0 - 3 scale or yes/no) to show patterns across several weeks.
I would suggest reviewing your symptoms with about 8 - 12 weeks of consistent tracking, looking for trends such as less ‘high‑pain’ days per month, shorter flare duration, or needing lower doses of pain meds.
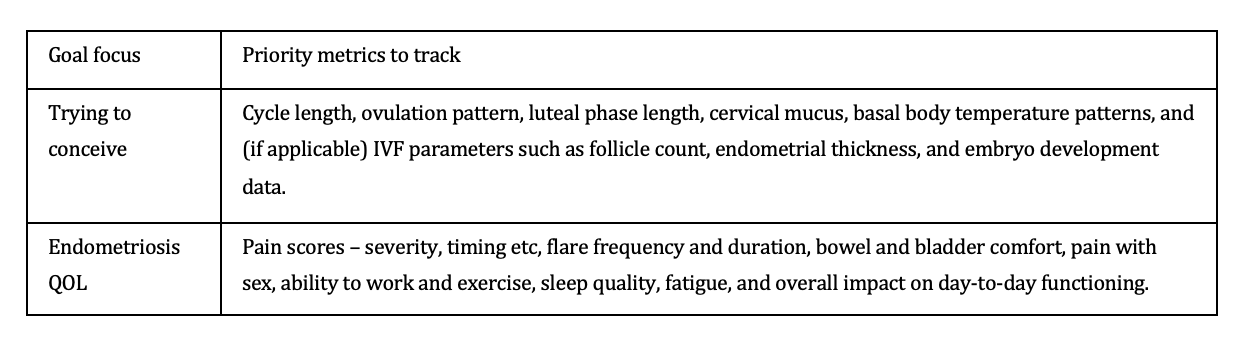
Suggested data to track for women with endometriosis.
How to Track Photobiomodualtion Related Changes
Tracking Red light therapy effects is about translating invisible cellular changes into visible data. Women can combine subjective observations with quantifiable markers to confirm positive changes.
Daily Observations
· Energy level and mental clarity
· Sleep quality
· PMS or menstrual discomfort
· Pain (due to endo or menstrual cramping) (use a 1–10 scale)
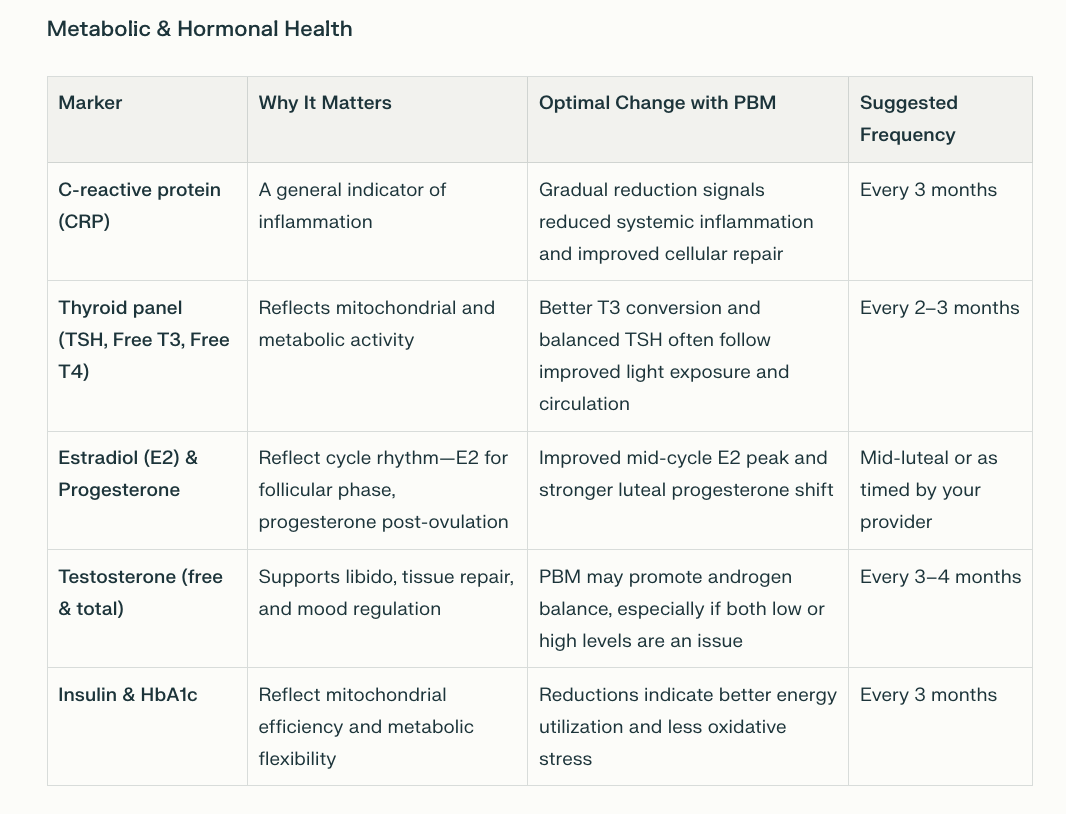
When women are monitoring physiological changes related to photobiomodulation (PBM), especially for fertility and hormone optimization, tracking biological markers offers objective validation of subtle internal improvements. In addition to temperature charts and cycle observations, these key biomarkers provide deeper insight into metabolic, hormonal, and ovarian function over time.
Core Markers for Systemic and Hormonal Health
Combining Fertility Charting and PBM
Women focusing on conception or cycle regulation can use fertility awareness charting to correlate red light therapy sessions with hormonal responses.
Step 1: Begin BBT Charting
Measure basal body temperature (BBT) each morning before getting up.
· A post-ovulation rise of 0.3 - 0.6°C signals ovulation.
· Stabilized follicular and luteal patterns indicate hormonal balance.
Step 2: Record Cervical Mucus
Note daily changes, dry, sticky, creamy, or eggwhite.
· Fertile quality mucus near ovulation becomes clearer and stretchier like egg white and is often improved after consistent red light therapy due to enhanced blood flow and estrogen response.
Step 3: Align PBM with Your Cycle
Use PBM most intensively from Cycle Day 1 - 14ish (follicular phase) to support egg maturation and uterine lining growth.
Step 4: Track in a Simple Chart
Three or more months of charting reveal individualized patterns of hormonal stabilization or improved ovulation timing.
Signs Red Light Therapy Is Working for You
As your body attunes to regular photobiomodulation:
· Cycle length becomes more consistent (26 - 32 days).
· Greater luteal phase stability (12 - 14 days).
· Improved cervical mucus quality.
· Less bloating, cramping, pain or PMS irritability.
· Stronger, biphasic BBT patterns.
PBM’s mitochondrial boost often shows up as subtle yet steady regularity across cycles, your body becoming energetically efficient and hormonally synchronized.
Tracking During IVF Cycles
For women integrating photobiomodulation (PBM) alongside in vitro fertilization (IVF), data tracking becomes even more essential. IVF involves multiple monitored parameters, many of which reflect PBM’s potential supportive effects on ovarian response, egg quality, and endometrial receptivity. By aligning PBM use with these clinical metrics, you gain clearer insights into how light therapy may be improving outcomes.
What You’ll Track During IVF
1. Follicle Count and Growth Rate
Measured through serial transvaginal ultrasounds (known as follicular tracking).
Follicles typically grow 1 - 2 mm per day, and mature follicles average 16 - 22 mm in diameter before egg retrieval.
An increase in the number of mature follicles per cycle may reflect improved mitochondrial and circulatory function in the ovaries, two pathways influenced by PBM.
2. Endometrial Lining Thickness and Quality
Optimal endometrial thickness is 8 mm or greater with a trilaminar appearance on ultrasound.
PBM has been shown in several studies to enhance uterine blood flow and improve lining receptivity, contributing to higher implantation rates.
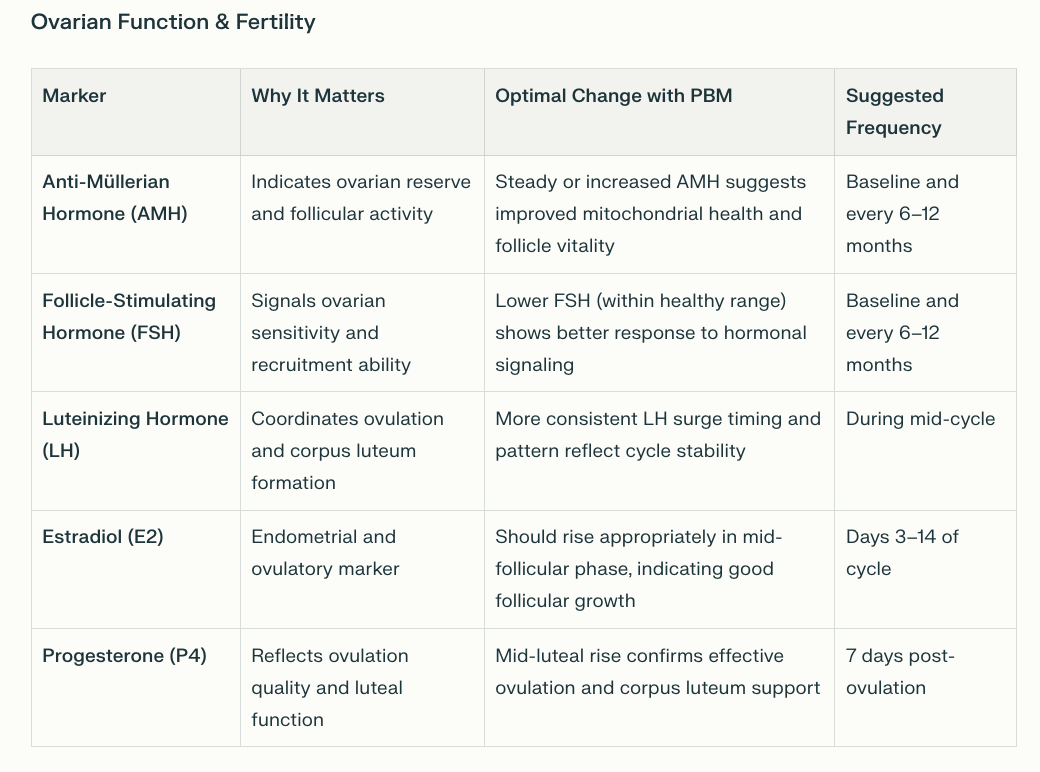
3. Hormonal Markers
Depending on your clinic - daily or every-other-day estradiol (E2) monitoring assesses follicular growth.
FSH and AMH from baseline labs gauge ovarian reserve and stimulation response. PBM may help stabilize these markers, especially for women with low AMH or elevated FSH.
LH and progesterone are monitored later in the cycle for ovulation timing and luteal support.
4. Egg Retrieval and Embryo Development Data
Total eggs retrieved, number of mature (MII) oocytes, fertilization rate, and blastocyst formation rate.
PBM may improve egg quality via mitochondrial biogenesis and enhanced oxidative resilience, leading to a greater number of viable embryos.
5. Implantation and Early Pregnancy Metrics
Embryo transfer day data: uterine lining, embryo grade, and receptivity indicators.
If implantation is normal, beta-hCG levels are monitored for implantation success and early pregnancy stability.
Note:
Follicle count and size = ovarian response to stimulation.
Endometrial thickness and pattern = implantation potential.
Fertilization and blastocyst rate = egg quality and mitochondrial energy efficiency
What About Wearables?
Wearables are where ancient cycle tracking meets modern biofeedback. Recent peer-reviewed validation studies show that the Oura Ring’s Fertile Window algorithm detects ovulation with 96.4% accuracy, within a 1.26-day margin of error, outperforming calendar-based or app-only tracking even for women with irregular cycles. It does this by combining temperature, resting heart rate, heart rate variability (HRV), and respiratory rate data, variables that respond to hormonal and circadian fluctuations. This matters for red light users because these same physiological markers (especially HRV and temperature variation) may reflect how their body is adapting to mitochondrial stimulation and hormonal rebalancing.
Like other data tracking tests, wearable data still need context. Illness, stress, or medication can temporarily alter readings.
Researchers have already begun integrating wearables and PBM in studies. In one trial, female athletes who used full-body PBM while wearing the Oura Ring showed improved cardiorespiratory recovery markers and optimized HRV readings, confirming that wearable data can objectively reflect PBM’s systemic effects.
Women can use wearables as part of their self-charting toolkit, aligning device-based data with PBM sessions, cycle day, and subjective changes.
Consider tracking:
Skin temperature trends (Oura Ring or WHOOP): detecting luteal phase shifts or thyroid-related thermoregulation.
Heart rate variability (HRV): improved HRV can indicate reduced oxidative stress and nervous system balance influenced by PBM.
Resting heart rate and respiratory rate: changes can correspond to enhanced cellular metabolism post-treatment.
At Home Tests
There are now multiple high-quality at-home testing options that women can use alongside traditional labs to monitor how their body responds to red light therapy particularly when optimizing fertility, hormones, metabolism, and gut or vaginal health. These tests allow women to collect precise biological data without needing frequent clinic visits.
Vaginal and Reproductive Microbiome Testing
A balanced vaginal microbiome supports conception and uterine health, and PBM is thought to help regulate its ecosystem through improved circulation and local immune modulation. Several at-home microbiome kits use genomic sequencing, such as the Evvy Vaginal Microbiome test.
Putting It All Together
Start with a simple charting framework that includes:
· Daily notes (energy, mood, sleep)
· PBM session data (time, area, duration)
· Cycle day, BBT, and cervical mucus
· Weekly reflections, lab results, wearable data (including ultrasound for medicated cycles).
After 2 - 3 cycles, review for progress patterns, higher mid-cycle energy, more predictable ovulation, or smoother periods. Adjust frequency or placement only after several months of consistent use.
If your PBM tracking chart looks inconsistent, flag life variables, travel, illness, supplement changes, or sleep disruption - as each can alter hormonal rhythms independently of light use.
When It’s Time for a Personalized PBM Review
If you’ve logged at least three full cycles with a red light device and still aren’t sure what’s shifting, or want help decoding your data book a 45‑minute protocol review. Together, we’ll uncover what your metrics are telling us and update your protocol for better results.
Light therapy isn’t one-size-fits-all. Subtle variables like device wavelength, treatment timing, or your underlying thyroid, glucose, or inflammatory patterns can heavily influence results. If progress has plateaued, that does not mean PBM isn’t working, it simply means your body may need a refined, data-driven approach.
During our 45-minute protocol review, we’ll take a step back and look at the full picture, including:
Your health history and reproductive or metabolic goals
Recent and past lab work, including hormones, thyroid, and glucose data
Details of your current device, frequency, and exposure patterns
Other factors like supplements, travel across time zones, or new stressors, which may temporarily distort your BBT, energy, or hormonal data
You’ll receive a custom-adjusted light protocol, tailored to your current physiology and life circumstances, so your PBM sessions deliver maximum benefit for fertility, hormone balance, or cellular recovery.
If you’re ready to move past guesswork and see tangible outcomes, book a protocol review today. Together, we’ll refine your plan, align your tools, and transform your tracking data into meaningful, measurable change.
The light is your feedback loop, reflecting your body’s repair, resilience, and potential. Learn to read it, and you’ll never have to guess whether it’s working again.
Tracy
Additional Resources:
https://blog.tracydonegan.org/blog/photobiomodulation-improves-ovarian-granulosa-cells
He et al., 2024. Photobiomodulation ameliorates ovarian aging by alleviating oxidative stress and inflammation damage and improving mitochondrial function.
Moradi Novin et al., 2024. A Comprehensive Systematic Review of the Effects of Photobiomodulation Therapy.
Amaral et al., 2023. Effects of Photobiomodulation Therapy on Human Sperm Function. Reproductive Biology.
https://pubmed.ncbi.nlm.nih.gov/39685560/
https://www.mdpi.com/2304-6732/12/10/1021